Academic project · University of Aberdeen · September 2026
Blood Cell Image Classification
Comparing a convolutional neural network with logistic regression across four blood-cell classes, and investigating overfitting, class imbalance, and generalisation to a small test set.
- Blood-cell classes
- 4
- Test images
- 71
- Models compared
- 2
The problem
Classify microscopy images as eosinophil, lymphocyte, monocyte, or neutrophil. I compared a CNN that learns spatial image features with a logistic regression model operating on flattened pixels, then examined how training behaviour and class-level errors affected performance on the supplied test set.
My contribution
- Prepared RGB images using a stratified training/validation split, resizing, pixel normalisation, and consistent class-label mapping.
- Implemented a three-block CNN and a multiclass logistic regression baseline, with validation-loss monitoring and early stopping.
- Compared test accuracy and confusion matrices, and analysed the gap between training, validation, and test performance.
Approach
Prepare the image data
Split the 9,957 supplied training images into 7,965 training and 1,992 validation images, preserving class proportions. Keep the 71 supplied test images separate.
Resize and normalise
Resize RGB images from 240 × 320 to 96 × 128 pixels while preserving aspect ratio. Scale pixel intensities to the range 0–1 and map the four classes to integer labels.
Compare spatial and linear models
The CNN uses 16, 32, and 64 convolutional filters with max pooling, followed by a dense layer and four output logits. Logistic regression uses flattened pixels and a four-output linear layer.
Monitor learning and errors
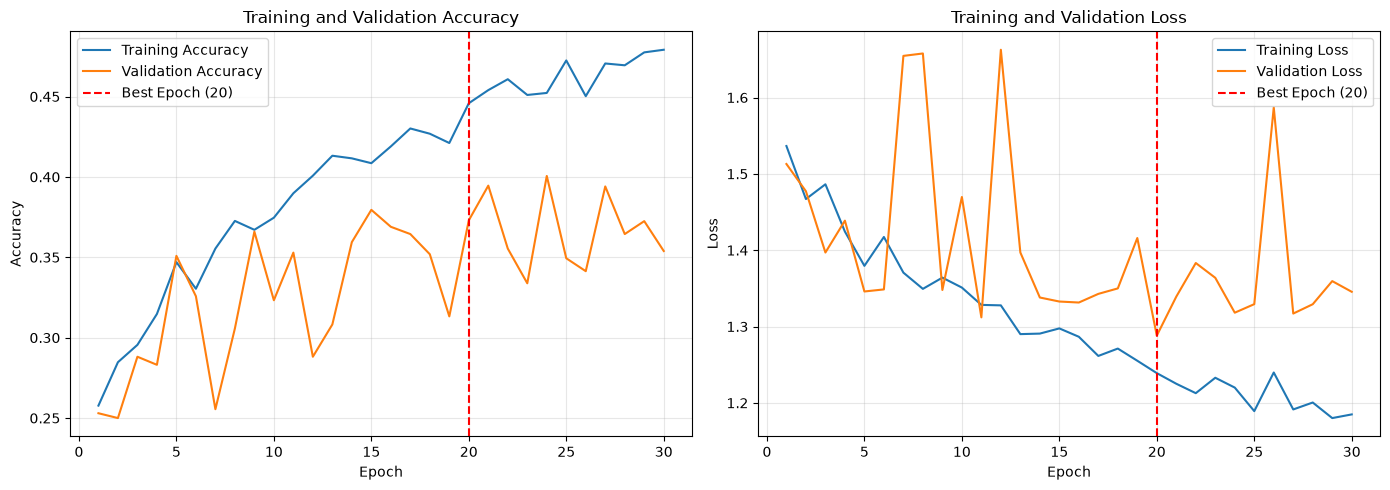
Use Adam and sparse categorical cross-entropy, with early stopping on validation loss and restoration of the best weights. Compare learning curves and per-class confusion matrices.
Results & findings
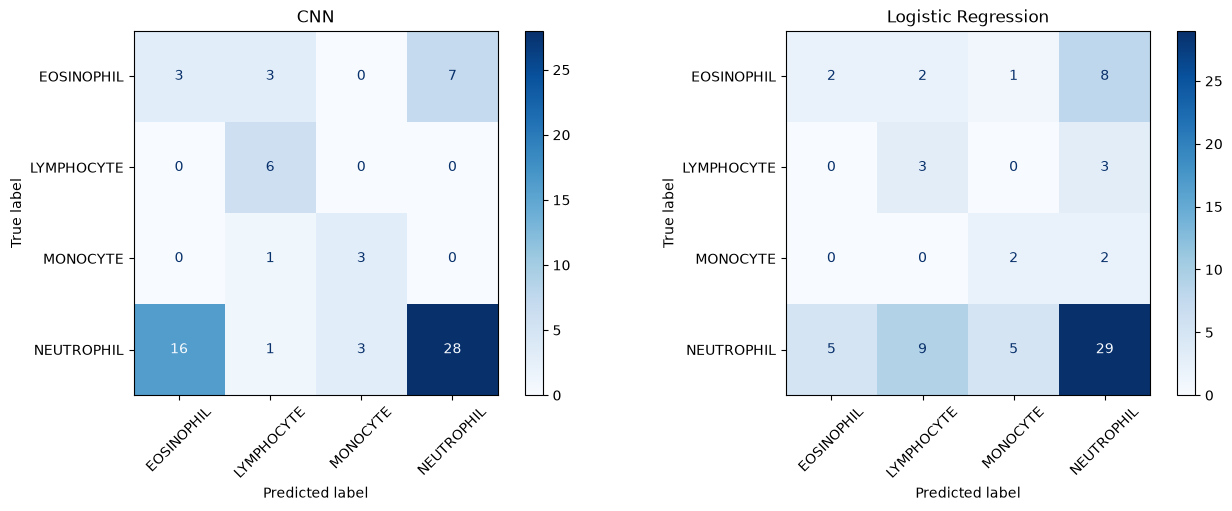
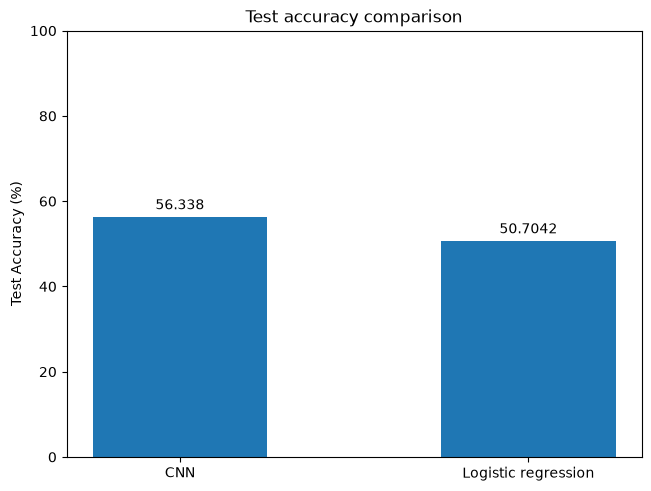
The CNN correctly classified 40 of 71 test images (56.34%); logistic regression classified 36 correctly (50.70%). For context, always predicting the most common test class, neutrophil, would classify 48 images correctly (67.61%). These results highlight the need to improve generalisation and evaluate class-level performance.
| Model / reference | Correct predictions | Test accuracy |
|---|---|---|
| CNN | 40 / 71 | 56.34% |
| Logistic regression | 36 / 71 | 50.70% |
| Majority-class reference (always neutrophil) | 48 / 71 | 67.61% |
Test distribution: 13 eosinophils, 6 lymphocytes, 4 monocytes, and 48 neutrophils. The majority-class reference always predicts neutrophil; it is not a trained model.
- The CNN's largest confusion was between neutrophils and eosinophils: 16 neutrophils were predicted as eosinophils, while 7 eosinophils were predicted as neutrophils.
- The CNN classified all 6 lymphocytes and 3 of 4 monocytes correctly. Those small class counts make the apparent per-class success uncertain.
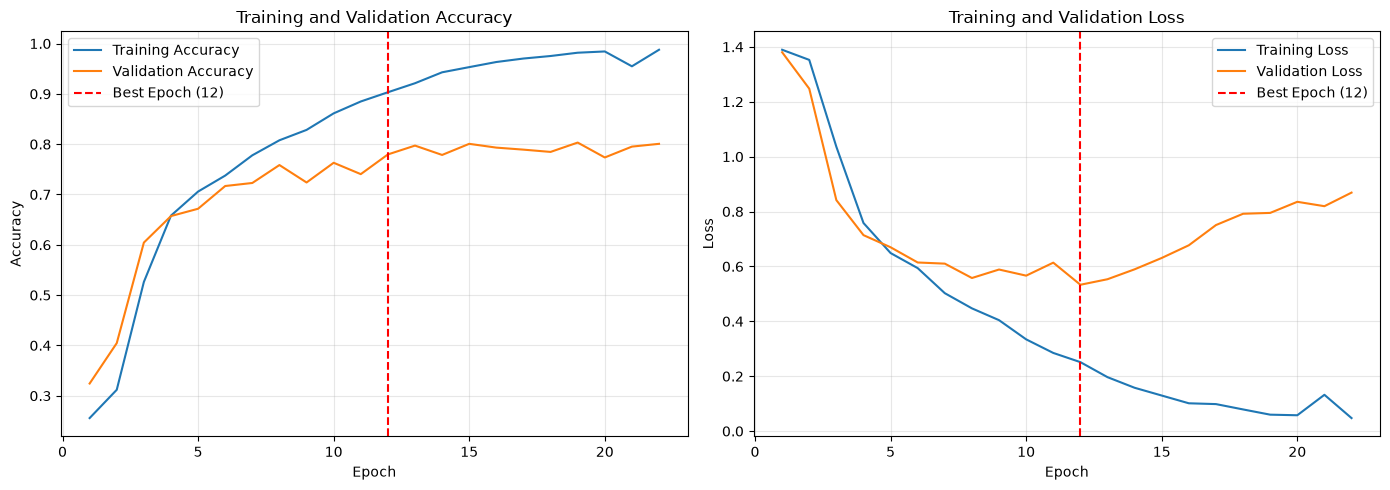
- CNN training accuracy continued improving after validation loss stopped improving. Early stopping selected the weights at epoch 12, but test accuracy remained much lower than validation accuracy.
Experiments & analysis
Select a figure to view it at full size.
Inspect the CNN architecture
Three convolution-and-pooling blocks learn spatial features before a dense layer produces four class scores. Inputs are 96 × 128 RGB images.
Python / Keras · Source excerpt
cnn_model = Sequential([
    layers.Input(shape=(IMG_HEIGHT, IMG_WIDTH, 3)),

    layers.Conv2D(16, 3, padding='same', activation='relu'),
    layers.MaxPooling2D(),

    layers.Conv2D(32, 3, padding='same', activation='relu'),
    layers.MaxPooling2D(),

    layers.Conv2D(64, 3, padding='same', activation='relu'),
    layers.MaxPooling2D(),

    layers.Flatten(),
    layers.Dense(128, activation='relu'),
    layers.Dense(NUM_CLASSES)
])
Limitations & what I learned
- Only 71 test images are available, and 48 are neutrophils. Overall accuracy is dominated by the most frequent class, so macro-averaged metrics and more balanced evaluation data would provide a fuller comparison.
- The comparison uses one architecture and training configuration for each model. It does not establish how either approach would perform after systematic tuning or across repeated runs.
- The training/validation-to-test gap requires further investigation. These academic results do not establish clinical validity.
Where I would take this next
- Investigate image-source differences, label consistency, and error examples to understand the validation-to-test gap.
- Evaluate augmentation, regularisation, and transfer learning using validation data, then measure macro F1, balanced accuracy, and per-class recall on a larger held-out set.